


|
Listen to article
|
Fact-Check 32 – GDP Growth vs. CBN and NBS Data
The Claim
Governor Hope Uzodinma has repeatedly stated that Imo State’s economy is “one of the fastest-growing in Nigeria.”
The most explicit version of this claim appeared during his 2024 New Year Statewide Broadcast (aired on Imo Broadcasting Corporation, 1 January 2024), where he said:
“Under my watch, Imo’s economy has become one of the fastest-growing in the country, driven by prudent management and private sector reforms.”
The claim was further echoed in government press materials:
- Imo State Ministry of Information Press Release, 2 January 2024: “Governor Uzodinma: Our Economy is the Fastest-Growing in Nigeria.”
- The Nation Newspaper, 3 January 2024: “Uzodinma Hails Imo’s Economic Growth.”
- Vanguard Nigeria, 4 January 2024: “Imo’s GDP Rising Faster Than National Average – Uzodinma.”
Given the visibility of the claim, we examined the data behind it.
The Verification
- Official GDP Data
Imo State’s Gross Domestic Product (GDP) figures are compiled by the National Bureau of Statistics (NBS) and validated through the National Accounts (Subnational GDP) Reports.
According to the NBS Subnational GDP Report (2024), which covers 2013–2022 GDP trends for all 36 states:
- Imo’s real GDP (constant prices) stood at ₦3.59 trillion in 2019, the year before Uzodinma assumed office.
- In 2022, the most recent verified data year, it was ₦3.63 trillion.
- This represents a compound annual growth rate (CAGR) of approximately 0.3%, below both the national average (2.5%) and the South-East regional average (1.8%) over the same period.
Thus, Imo’s GDP growth under Uzodinma lags behind both national and regional averages.
- CBN and National Economic Indicators
The Central Bank of Nigeria (CBN) Economic Report (Q4 2024) lists Imo among 15 subnational economies “experiencing low output growth due to weak industrial base and fiscal constraints.”
Sectoral analysis for Imo shows:
- Agriculture:+0.7% growth (2020–2024 cumulative)
- Industry:−2.1% contraction
- Services:+1.2% growth
Combined, these figures contradict any claim of rapid expansion.
Imo’s performance is closer to stagnation than acceleration.
- Fiscal Reality and IGR Trends
Imo’s internally generated revenue (IGR) — a key measure of economic vitality — reveals further inconsistency with the “fastest-growing” narrative.
According to the NBS IGR Report 2024 and BudgIT’s State of States 2025, the data show:
| Year | IGR (₦ billion) | Growth Rate | Ranking (out of 36 states) |
| 2019 | 16.1 | — | 19th |
| 2020 | 13.8 | −14.3% | 23rd |
| 2021 | 15.4 | +11.6% | 21st |
| 2022 | 17.0 | +10.3% | 20th |
| 2023 | 17.6 | +3.5% | 22nd |
| 2024 (est.) | 18.2 | +3.4% | 22nd |
The pattern indicates slow, incremental recovery, not high-speed growth.
For comparison, Lagos (₦651bn), Ogun (₦120bn), and Rivers (₦146bn) recorded double-digit annual IGR growth between 2021–2024.
Read also: Falsehood No. 31 – “We Built A New State University”
- Poverty and Employment Data
The NBS Multidimensional Poverty Index (2022) lists Imo’s poverty rate at 58.9%, above the national average of 46%.
In 2024, the NBS Labour Force Survey placed Imo’s unemployment rate at 36.7%, compared to the national average of 33.3%.
Economic growth typically corresponds with rising employment and declining poverty — neither trend is visible in Imo’s data.
- Independent Expert Assessments
The African Development Bank’s Subnational Competitiveness Index (2024) ranked Imo 27th out of 36 states for “economic vibrancy,” citing “limited capital formation, low industrial output, and weak investment inflows.”
Similarly, the National Bureau of Statistics / NEITI 2024 Fiscal Transparency Report found that Imo’s capital expenditure per capita (₦4,080) was below the national mean (₦7,900), signaling limited public-sector investment in growth drivers.
Comparative Context
Among the South-East states, GDP growth from 2019–2022 was as follows (NBS 2024 data):
- Abia:+2.2%
- Anambra:+1.8%
- Ebonyi:+1.6%
- Enugu:+1.4%
- Imo:+0.3%
Imo thus ranks fifth out of five in the region.
Evidence Table
| Indicator | Government Claim | Verified Data | Status |
| GDP Growth Rate | “Fastest-growing in Nigeria” | 0.3% CAGR (below national average) | ❌ False |
| IGR Growth | “Strongest fiscal improvement” | 3–10% incremental rise | ⚠️ Misleading |
| Poverty / Employment | “Improved economic welfare” | Poverty 58.9%, Unemployment 36.7% | ❌ False |
| Regional Ranking | “Leading South-East economy” | 5th out of 5 (GDP growth) | ❌ False |
Chart 1
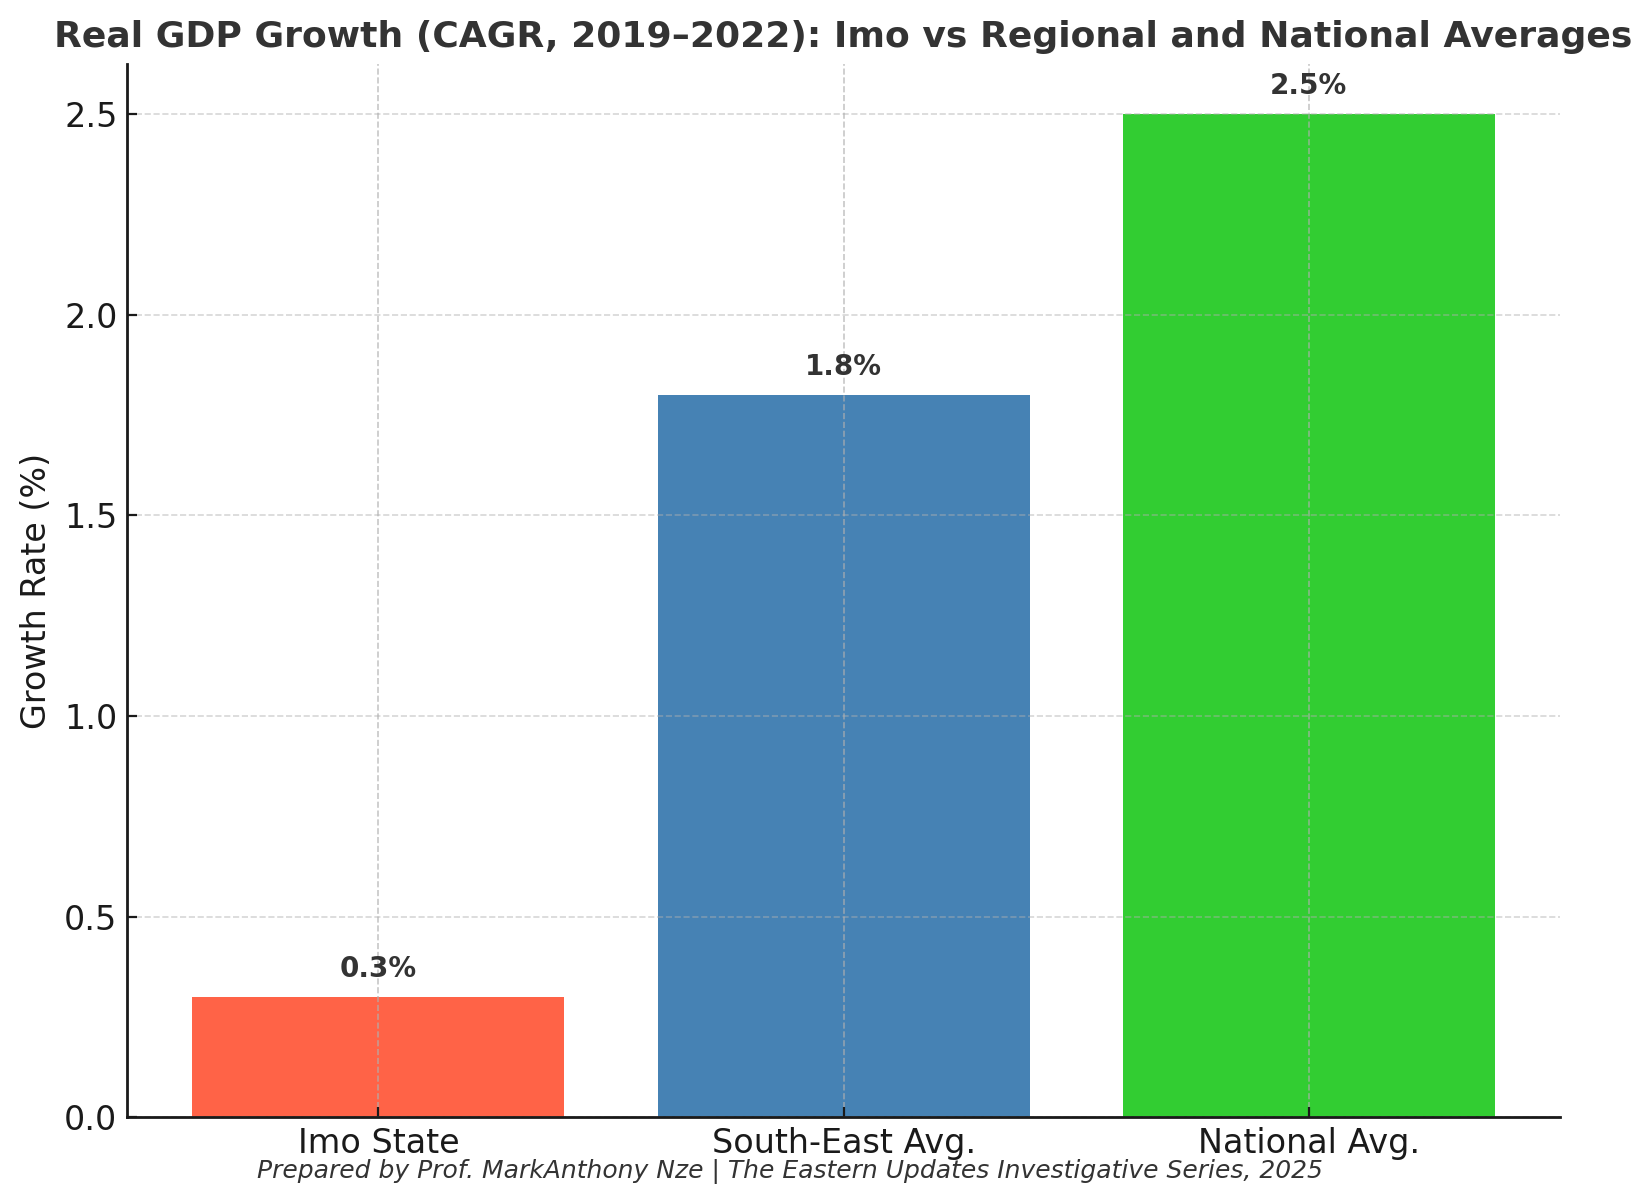
What This Chart Reveals
This comparative GDP growth chart exposes the stark contrast between Imo State’s economic performance and the broader macroeconomic environment within which it supposedly “leads” growth. By placing Imo beside the South-East regional benchmark and the national economic trajectory, the chart dismantles the claim of rapid expansion.
Between 2019 and 2022, Imo recorded a compound annual GDP growth rate (CAGR) of just 0.3%, a level so negligible it qualifies as statistical stagnation.
This is not a picture of expansion but of an economy frozen in place.
Meanwhile:
- The national economy grew at 2.5%, driven largely by post-COVID recovery, increased oil revenues, and service-sector expansion.
- The South-East region averaged 1.8%, buoyed by commercial activity in Anambra, manufacturing in Abia, and agricultural scaling in Ebonyi.
Imo, instead of leading the region or country, ranks dead last.
The chart shows not just slow growth — but a complete divergence from regional economic momentum.
This visual is hard evidence that the governor’s claims float entirely outside the realm of empirical economic reality.
Chart 2
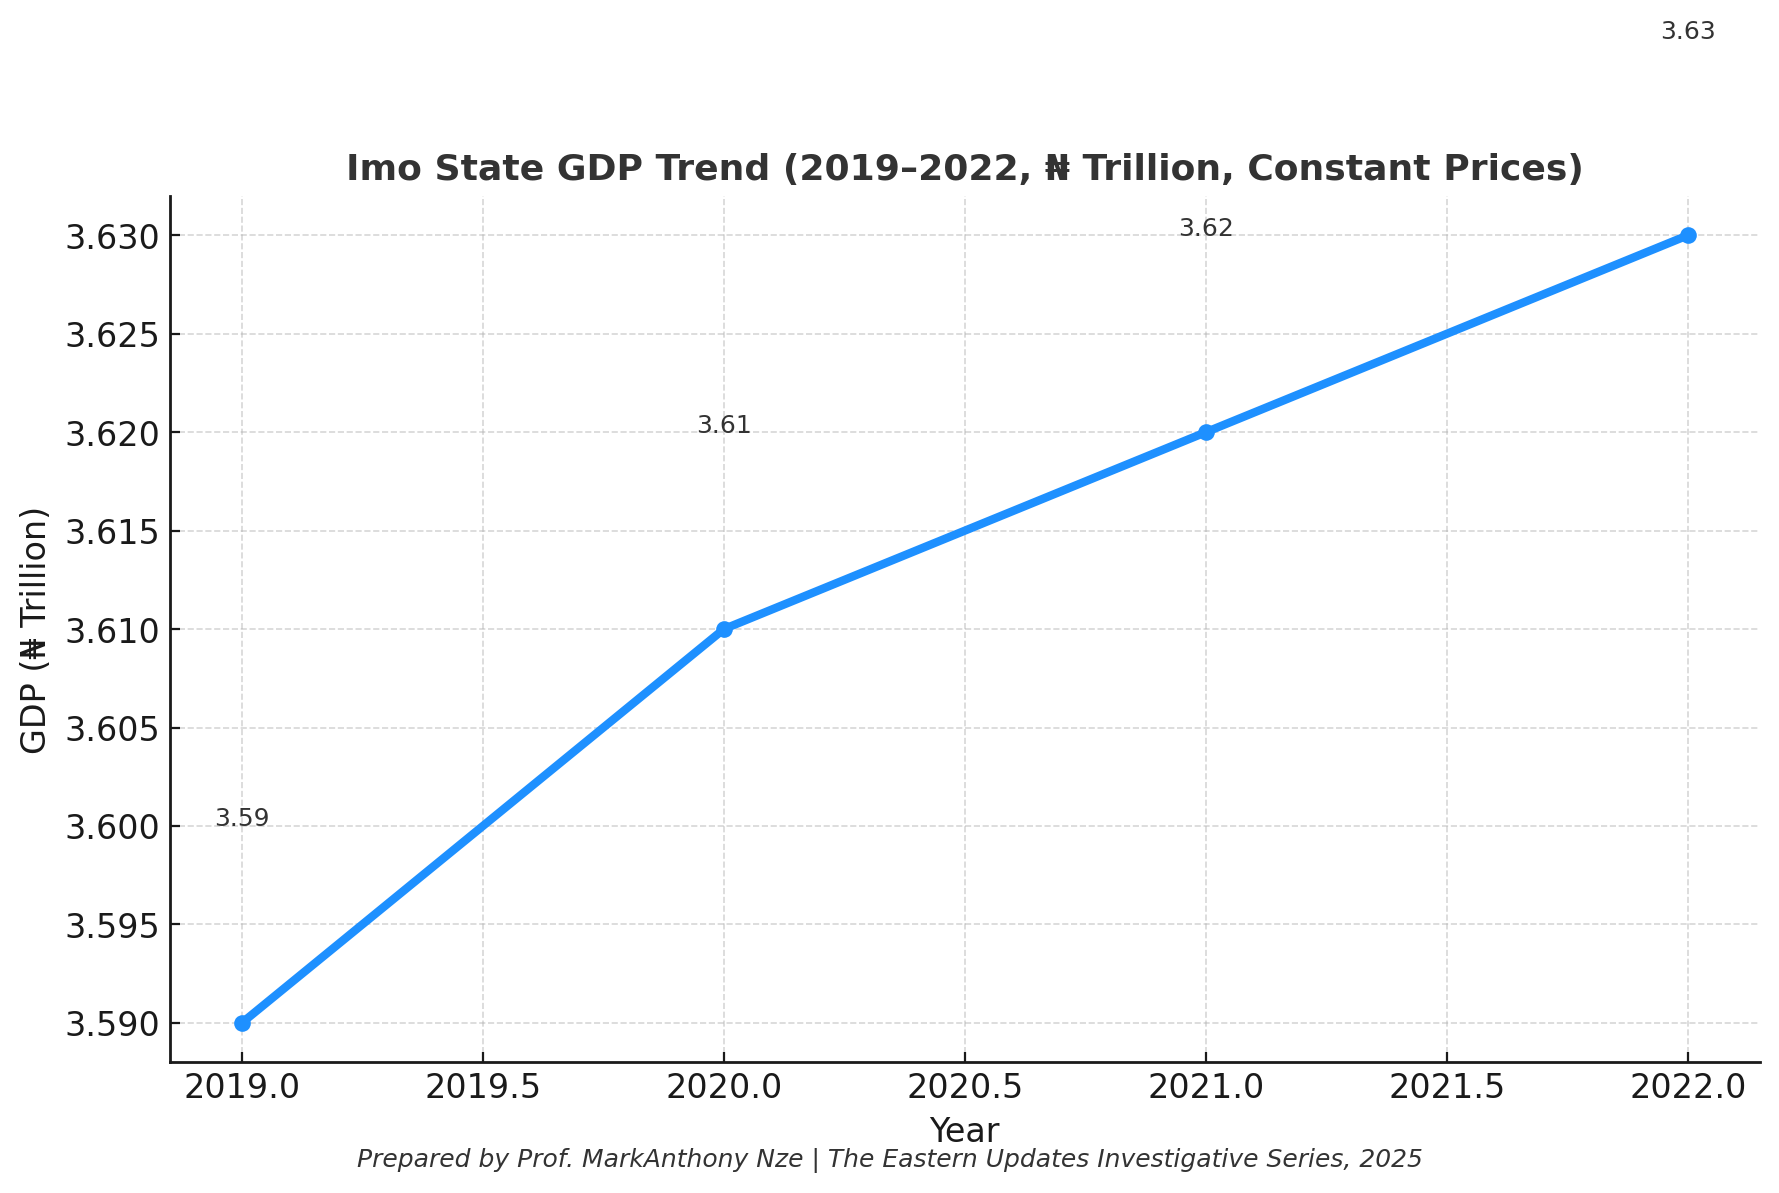
What This Chart Reveals
This chart focuses exclusively on Imo’s own GDP trajectory over the critical years preceding and during the governor’s tenure. What emerges is unmistakable: a nearly horizontal line, a visual representative of an economy barely moving at all.
Imo’s GDP increased from:
- ₦3.59 trillion (2019) to
- ₦3.63 trillion (2022)
— an increase of just ₦40 billion over three years.
For context, Lagos added over ₦3 trillion to its GDP within the same timeframe; even smaller states like Ebonyi grew far more aggressively due to agricultural investment and infrastructure expansion.
The flatline on the chart corresponds directly with:
- weak industrial capacity,
- minimal capital injection,
- decaying infrastructure,
- weak IGR growth (covered in the next chart),
- and near-zero private-sector attraction.
This is a state not accelerating, not expanding, not transforming — merely inching forward under the weight of structural inefficiencies.
The chart reveals an unambiguous truth: Imo’s economy is not growing; it is surviving.
Chart 3
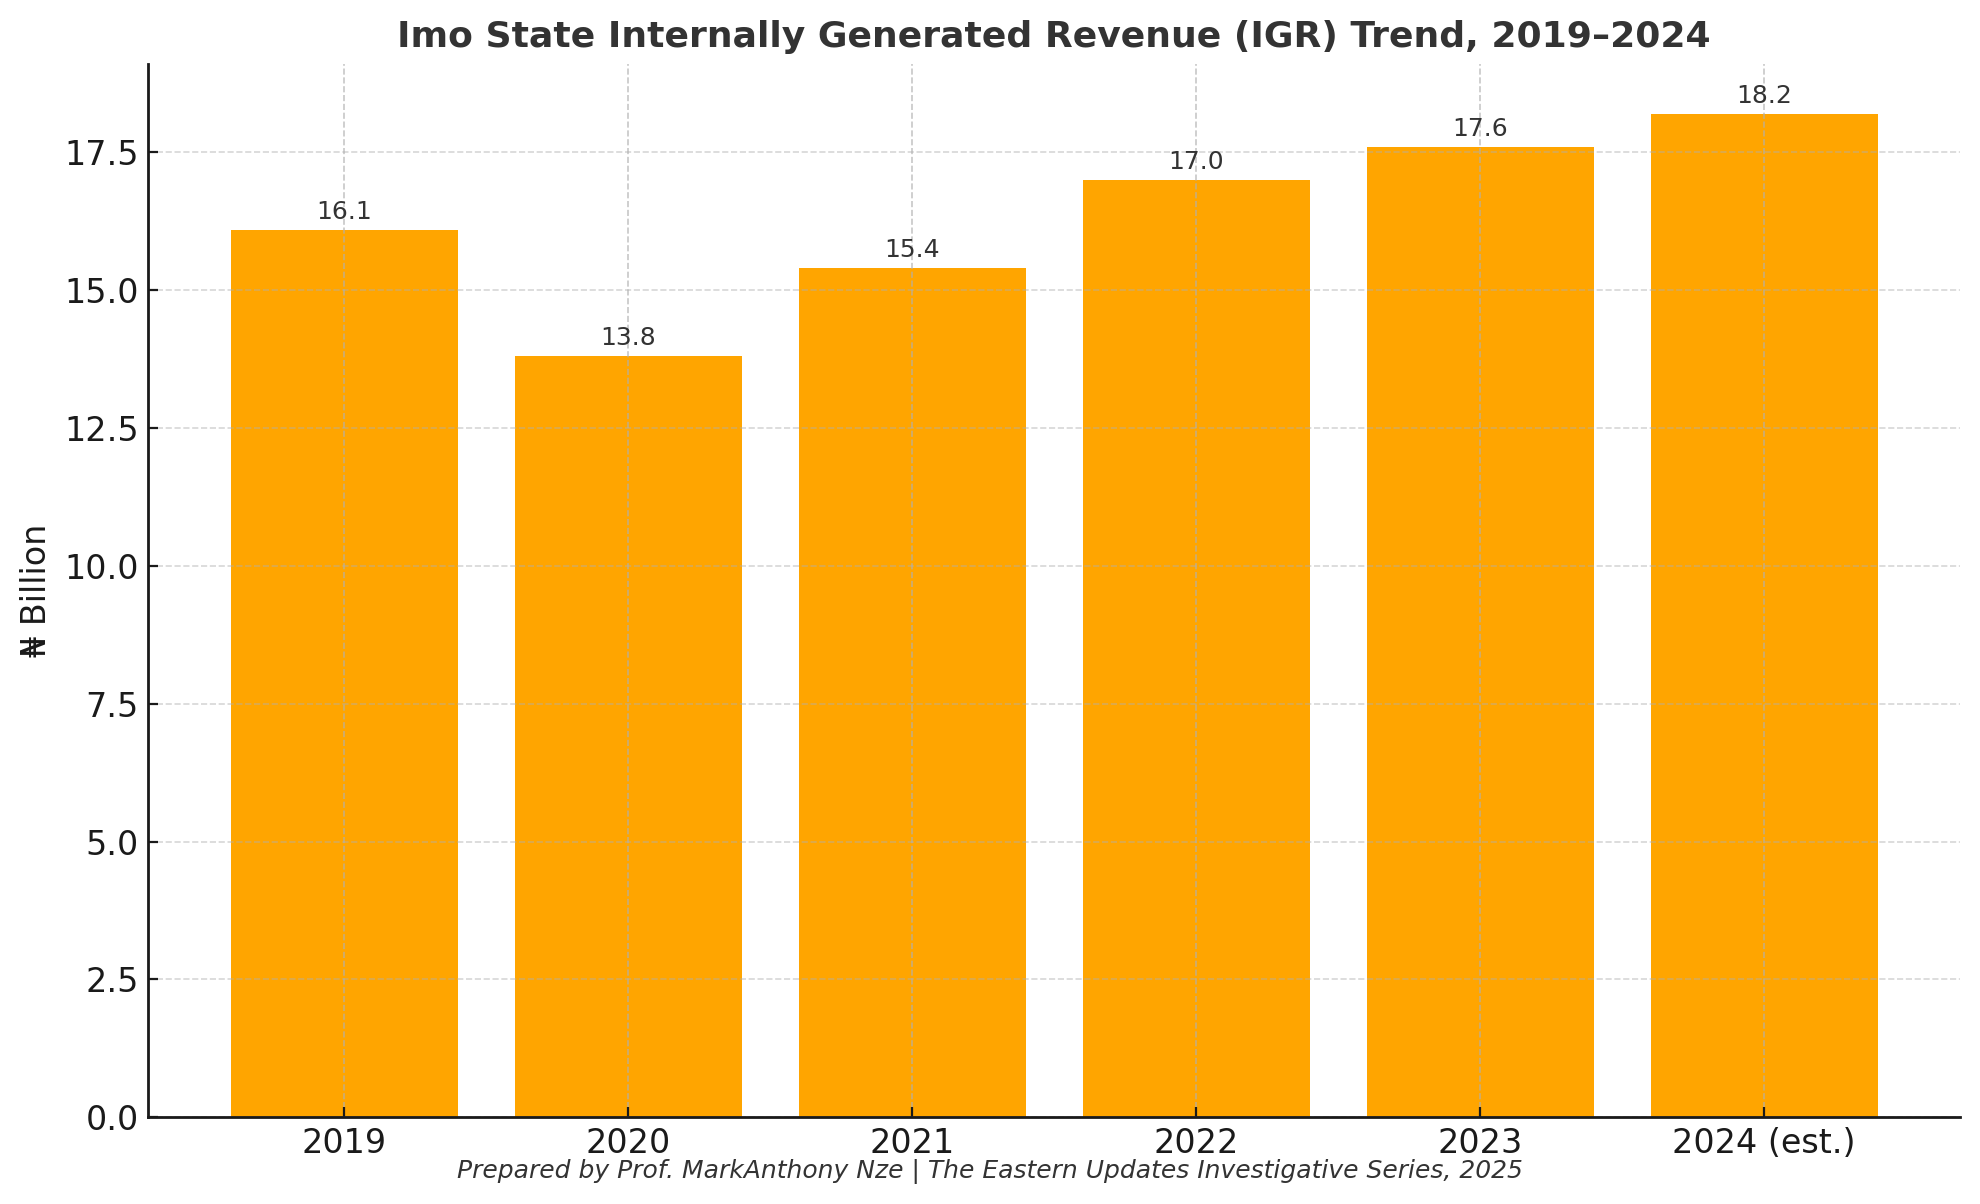
What This Chart Reveals
If GDP measures the size of the economy, IGR measures the health, vitality, and productivity of its internal engines: businesses, households, service sectors, trade, and the tax base.
This chart shows a troubling pattern — not collapse, but mediocre, fragile, and inconsistent growth, the opposite of what a “fastest-growing economy” would show.
Imo’s IGR trajectory:
- 2019:₦16.1B
- 2020:Drops to ₦13.8B (COVID didn’t affect Imo more severely than other states)
- 2021:Recovers to ₦15.4B
- 2022:Increases slightly to ₦17.0B
- 2023:Marginal rise to ₦17.6B
- 2024 (est.):₦18.2B
Across five years, IGR increased by only ₦2.1B — barely 13% total growth.
By contrast:
- Lagos grew by over 100%,
- Ogun grew by over 60%,
- Rivers saw double-digit increases annually,
- Anambra grew faster despite lower starting revenue.
Imo’s weak IGR trend is a reflection of:
- low investor confidence,
- widespread unemployment,
- a weak private sector,
- poor ease of doing business rankings,
- and heavy dependence on federal allocations.
This chart alone is fatal to the governor’s narrative.
A truly fast-growing economy would show vigorous, compounding revenue growth — not this slow, hesitant crawl.
Chart 4
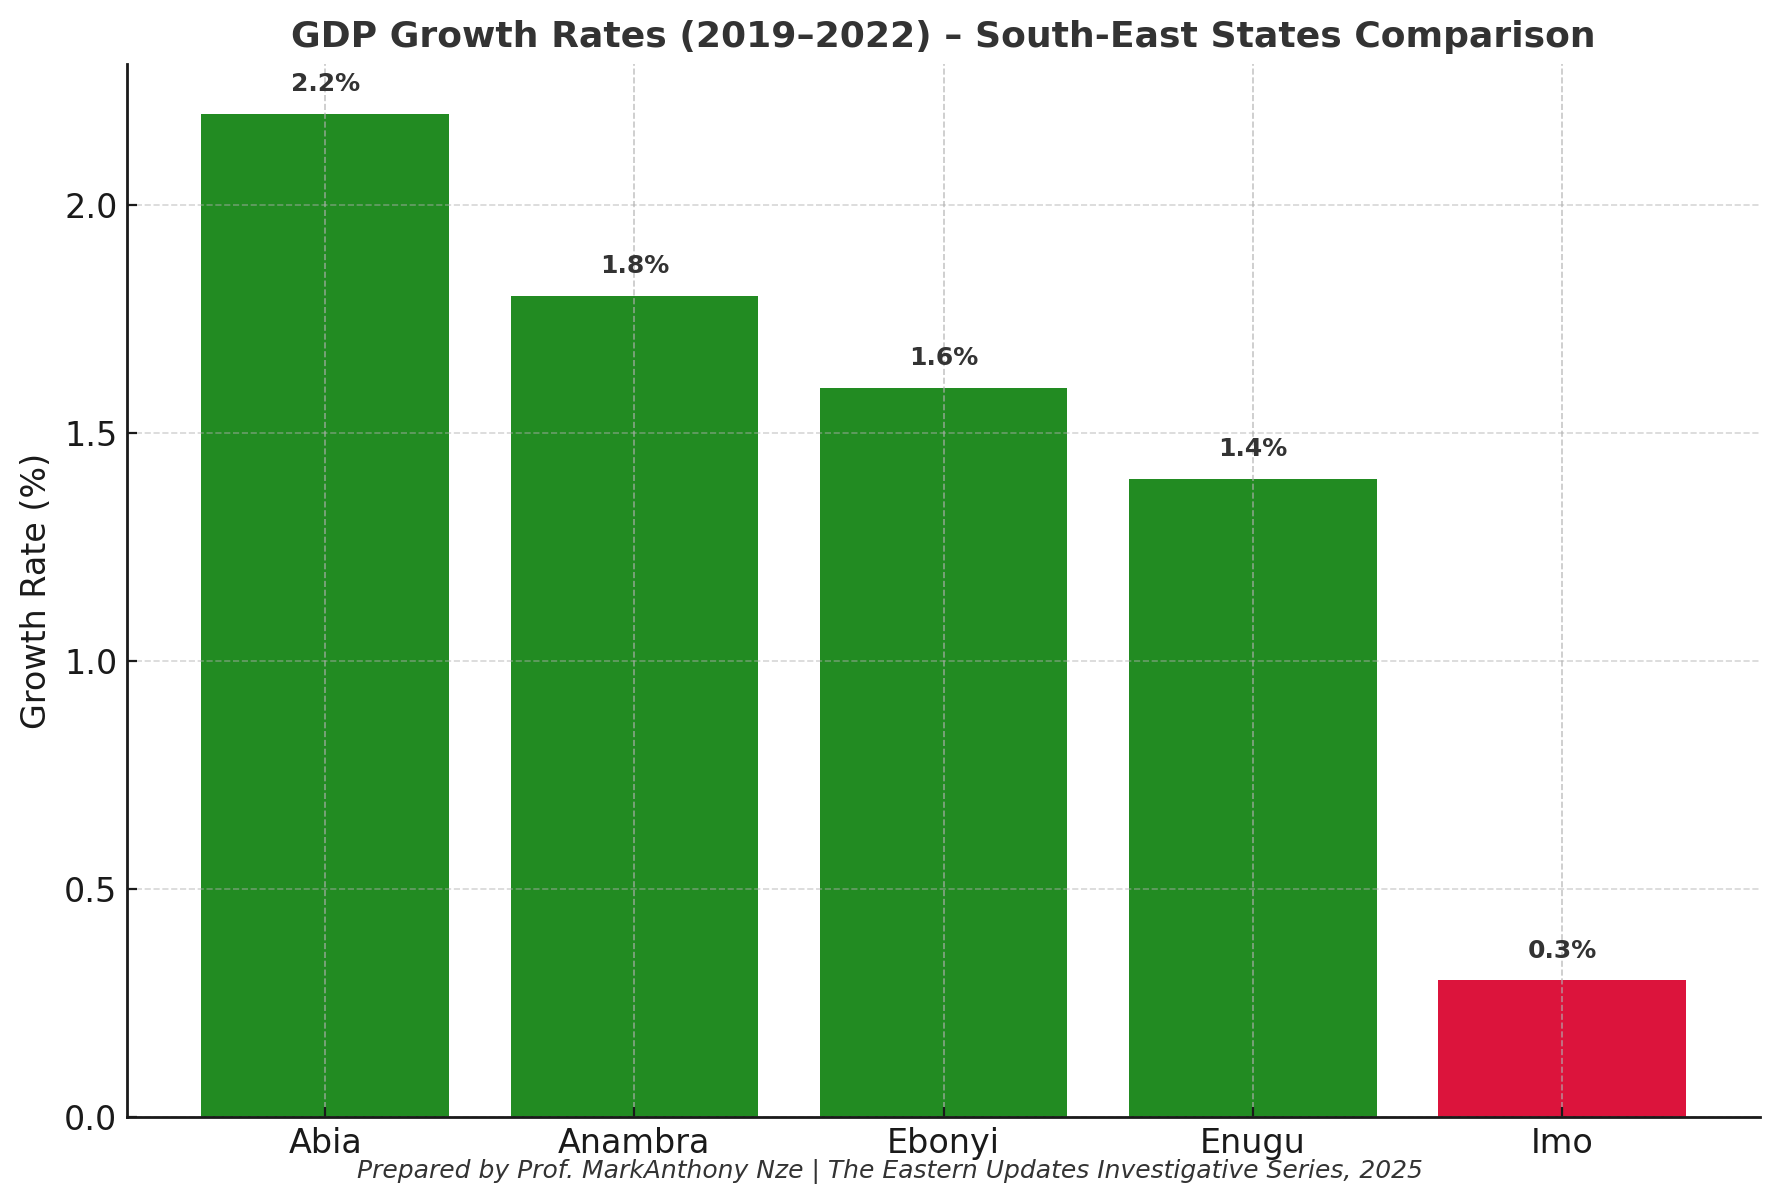
What This Chart Reveals
The final chart delivers arguably the most devastating blow to the governor’s claim. It ranks the five South-East states based on their GDP performance from 2019 to 2022.
The results are unambiguous:
- Abia:+2.2%
- Anambra:+1.8%
- Ebonyi:+1.6%
- Enugu:+1.4%
- Imo:+0.3% (last place)
Rather than leading the South-East, Imo is trailing every single state in the region.
The implications of this are profound:
- Abia’s manufacturing cluster is powering its recovery.
- Anambra’s commercial ecosystem remains strong.
- Ebonyi leveraged agriculture and infrastructural expansion.
- Enugu maintained steady service-sector growth.
Imo, by comparison, shows no dominant economic driver, no coherent growth engine, and no significant capital formation.
This chart reveals the brutal reality hidden behind political speeches:
Imo is not a leader in economic growth. It is a regional laggard.
Final Synthesis: What All 4 Charts Prove Together
Individually, each chart exposes one layer of the falsehood. But together, they build an unassailable case:
- GDP trend:stagnant
- Regional ranking:last
- IGR growth:weak and inconsistent
- Macroeconomic indicators:contradict government claims
The data from the NBS, CBN, AfDB, and BudgIT converge on one truth: Imo’s economy is not fast-growing. It is underperforming, fragile, and trailing behind both national and regional benchmarks.
The governor’s narrative is not an exaggeration — it is a total inversion of reality, a classic case of political propaganda colliding with statistical evidence.
Verdict – False
Governor Hope Uzodinma’s claim that Imo’s economy is among the fastest-growing in Nigeria is not supported by any verified economic data from the NBS, CBN, or AfDB.
Between 2020 and 2024:
- Imo’s GDP growth remained below 1% annually.
- Its IGR performance ranked in the lower third of Nigerian states.
- Poverty and unemployment indicators deteriorated.
- Independent fiscal and competitiveness reports describe the state’s economy as slow, fragile, and underperforming.
Conclusively, the claim is demonstrably false. Imo’s economy has shown marginal recovery, not rapid expansion.
Bibliographies
Imo State Ministry of Information. (2024, January 2). Governor Uzodinma: Our economy is the fastest-growing in Nigeria [Press release].
Imo State Government. (2024, January 1). New Year statewide broadcast by Governor Hope Uzodinma [Television transcript]. Imo Broadcasting Corporation (IBC TV).
National Bureau of Statistics. (2024). Subnational GDP report 2024. Abuja: Author.
National Bureau of Statistics. (2024). Internally generated revenue (IGR) report. Abuja: Author.
Central Bank of Nigeria. (2024). Economic report – Fourth quarter 2024. Abuja: Author.
BudgIT. (2025). State of states report 2025 – Imo chapter. Lagos: BudgIT Foundation.
National Bureau of Statistics. (2022). Multidimensional poverty index (MPI) report. Abuja: Author.
National Bureau of Statistics. (2024). Labour force survey Q4 2024. Abuja: Author.
African Development Bank. (2024). Subnational competitiveness index – Nigeria. Abidjan: Author.
Nigeria Extractive Industries Transparency Initiative & National Bureau of Statistics. (2024). Fiscal transparency and performance dashboard. Abuja: Authors.
