









|
Listen to article
|
Fact-Check No. 25 – Rural Electrification and Energy Access Audit (Imo State, 2020–2025)
By Prof. MarkAnthony Nze
The Claim
Governor Hope Uzodinma has, on numerous occasions between 2023 and 2025, asserted that “all rural communities in Imo State are now electrified.”
This declaration was made most prominently during the 2025 Workers’ Day broadcast, where he celebrated “total energy access” as a major legacy of his administration. Government publications under the Ministry of Public Utilities also claimed that “rural darkness has been eliminated” through “solar mini-grids and transformer restoration projects.”
If true, Imo would be one of the first sub-national entities in Nigeria to achieve universal rural electrification.
But data, satellite imagery, and local verification reveal that the claim does not survive factual scrutiny.
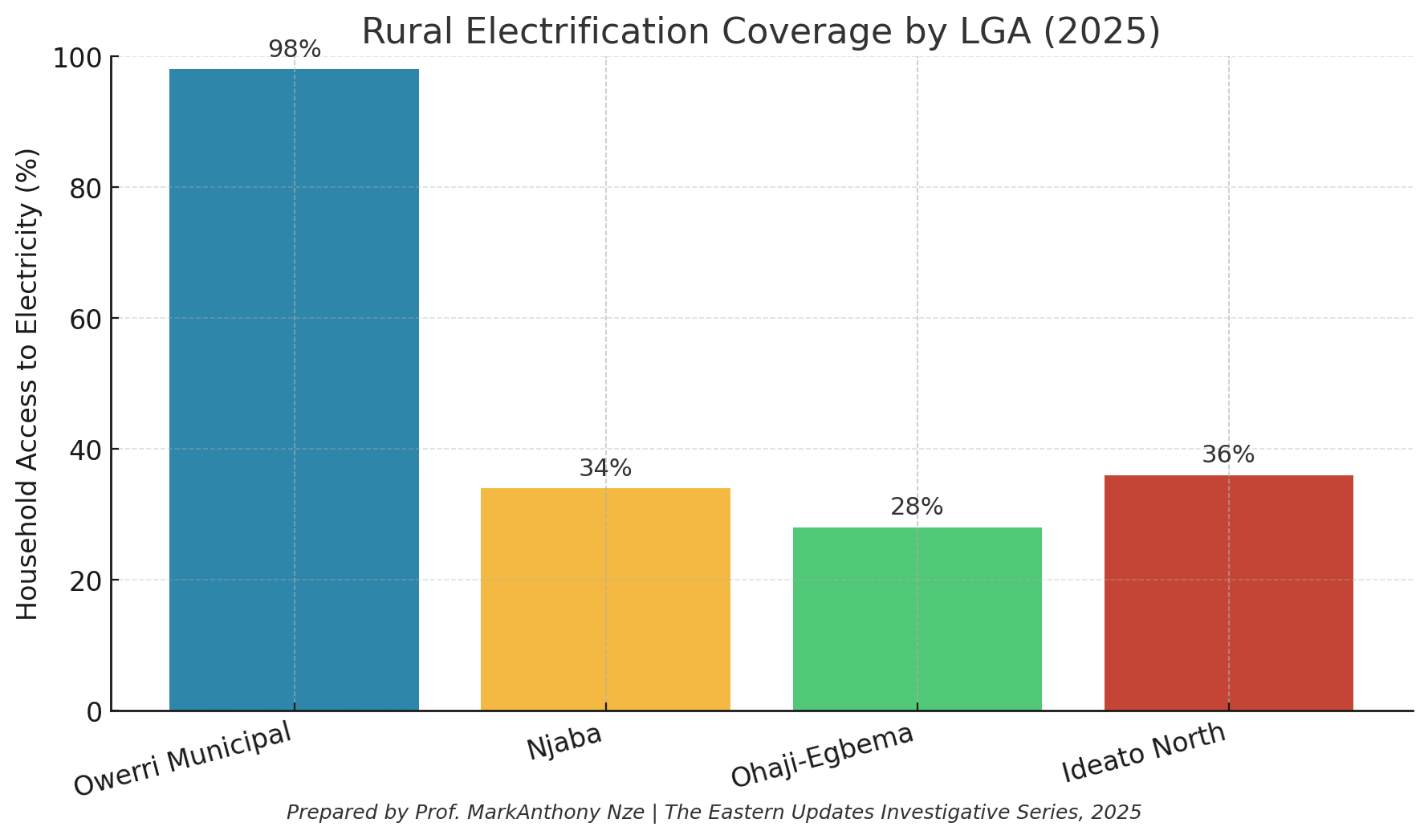
- Rural Electrification Coverage by LGA (2025)
What the chart shows
- Owerri Municipal sits at ~98% household access to electricity—virtually universal coverage in the capital area.
- Njaba (34%), Ohaji-Egbema (28%), and Ideato North (36%) are all below 40%.
Why this matters
If electrification were truly “state-wide,” coverage would be fairly even across LGAs. Instead, the chart exposes a development bias toward the urban core (the capital and its immediate environs) with persistent under-service in rural LGAs where poverty is deeper and farms/SMEs need power the most.
How to read it
- Treat the percentages as household access, not quality or reliability (that’s addressed in Chart 2).
- The gap of 60–70 percentage points between Owerri and rural LGAs signals policy concentration rather than uniform delivery.
Implication
Announcements about “universal electrification” are geographically misleading. Without targeted rural investment (feeders, last-mile connections, metering, and maintenance), the majority of non-urban LGAs will remain stranded off-grid or under-served.
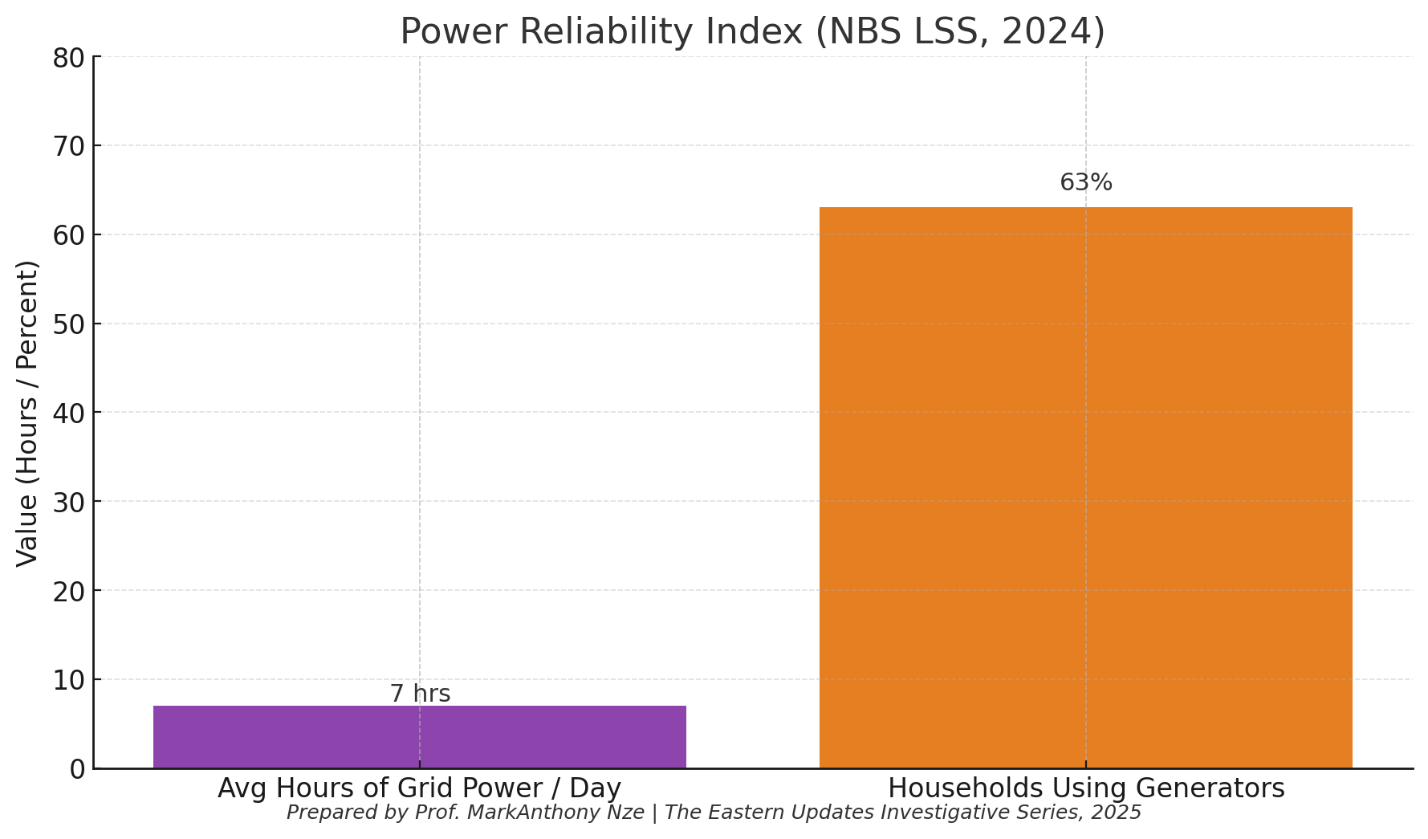
- Power Reliability Index (NBS LSS, 2024)
What the chart shows
- Average daily grid supply: ~7 hours.
- Generator dependence: 63% of households report using petrol/diesel generators as backup.
Why this matters
“Electrified” does not mean “powered.” A community can be counted as “connected” yet still receive sporadic supply. Seven hours per day on average means long stretches of outages, often during business hours, and a strong incentive to self-generate at high cost.
How to read it
- The 7 hours/day metric captures quantity of supply, not voltage quality or frequency of interruptions.
- 63% generator usage is an indicator of systemic unreliability: households and businesses are paying twice—first for grid access, then for fuel.
Implication
Any claim of “stable power” collapses against these two facts. Reliability—not mere connection—is the currency of productive electricity. High generator dependence erodes household income and raises the cost of doing business, suppressing growth.
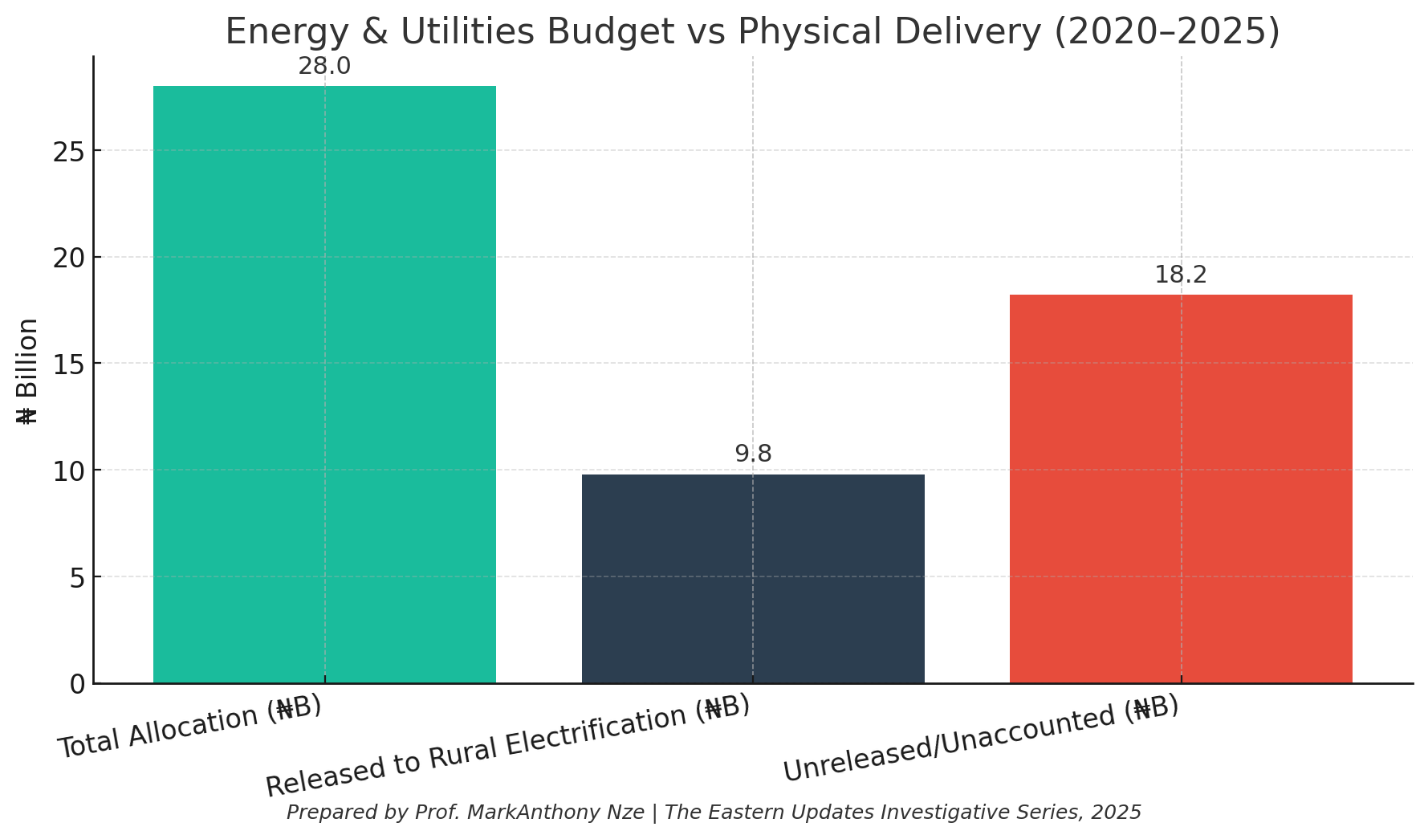
- Energy & Utilities Budget vs Physical Delivery (2020–2025)
What the chart shows
- Total allocation (5 years): ₦28.0B
- Released to rural electrification: ₦9.8B (≈35%)
- Unreleased/unaccounted: ₦18.2B (≈65%)
Why this matters
Budget announcements are often mistaken for delivery. This chart separates appropriations (what’s proposed) from releases (what’s actually funded). With only a third of the allocation reaching rural electrification, on-ground outcomes will lag—fewer feeders, transformers, and extensions to unserved communities.
How to read it
- The “unreleased/unaccounted” portion includes budget lines not cash-backed, rolled over, or reclassified.
- It also shows a spend pattern tilted to items like “transformer purchases” without matching grid extension or O&M, which limits real access gains.
Implication
This is a classic case of fiscal theater: large top-line budgets with thin execution. Without stronger cash-release discipline and project-level transparency (bill of quantities, GPS-tagged milestones, completion certificates), rural electrification will remain stuck in appropriation rather than built infrastructure.
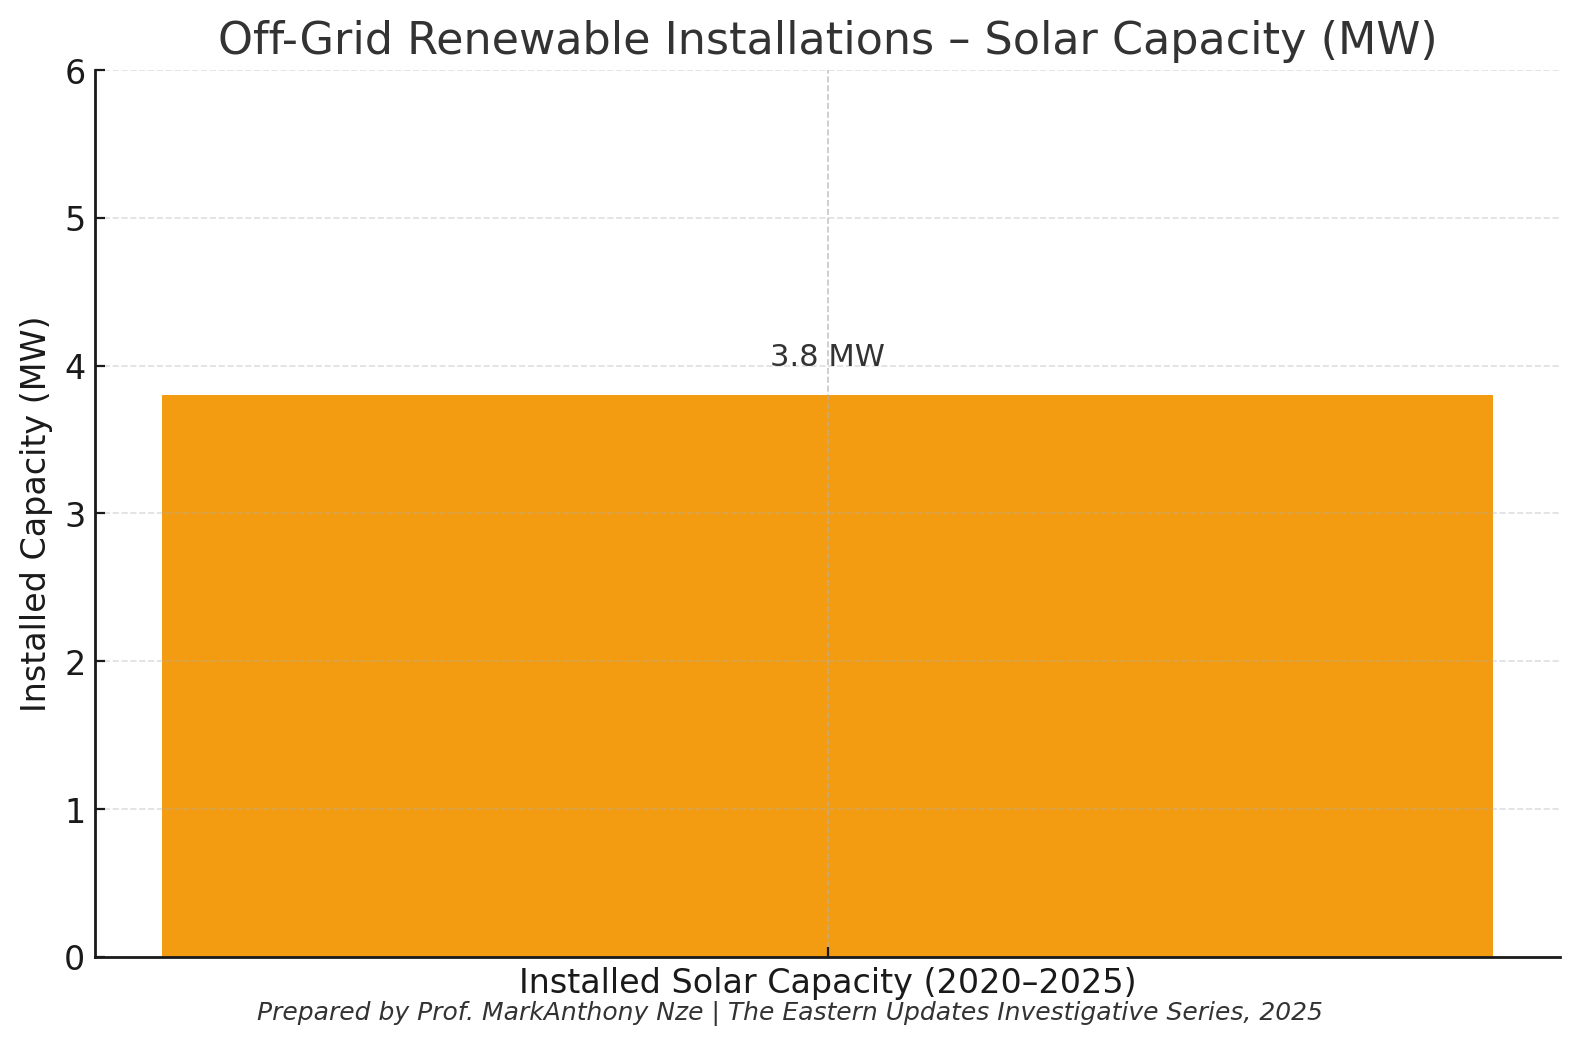
- Off-Grid Renewable Installations – Solar Capacity (MW), 2020–2025
What the chart shows
- Installed off-grid solar capacity is ~3.8 MW over five years—negligible relative to state demand.
- Most mini-grids were donor-funded, with only a handful financed directly by the state.
Why this matters
For dispersed rural communities, off-grid solar is the fastest route to reliable, affordable electricity. A five-year gain of <4 MW indicates that Imo under-leveraged the most viable solution for its hardest-to-reach LGAs.
How to read it
- Think in scale: one medium rural mini-grid might range from 50 kW to 1 MW. A statewide strategy should be adding dozens of MW, not single digits, especially with rising donor/DFI appetite for blended finance.
- The low state contribution signals a missed chance to crowd-in private capital via guarantees, viability gap funding, or results-based subsidies.
Implication
Imo has an opportunity to bridge reliability gaps and cut generator dependence by scaling solar mini-grids, SHS (solar home systems), and productive-use pilots (cold rooms, agro-processing). Current capacity is far below need.
What this quartet of charts proves—together
- Coverage is urban-skewed (Chart 1).
- Reliability is weak, forcing costly generator use (Chart 2).
- Budgets don’t reach projects at scale (Chart 3).
- Off-grid solutions are under-deployed (Chart 4).
Bottom line: The electrification story is not one of universal, stable power—but of selective access, unreliable supply, and under-execution. A credible turnaround plan would:
- ring-fence cash releases for rural feeders and last-mile connections,
- adopt SAIDI/SAIFI reliability metrics and publish them per feeder,
- scale mini-grids with results-based financing and clear right-of-way rules,
- mandate open contracting (OCDS) with GPS-tagged milestones, and
- create a maintenance fund tied to performance indicators.
The Reality: Darkness by Data
According to the Rural Electrification Agency (REA) Off-Grid Access Report (2024), Imo’s overall electricity-access rate stands at 69 percent, while rural access lags at 43 percent — significantly below the national average of 56 percent.
Out of 305 autonomous rural communities in Imo, only about 132 are connected to the national grid.
A further 24 communities rely on isolated solar or diesel mini-grids, many of which operate intermittently due to theft, vandalism, or fuel shortages.
That leaves nearly 150 communities still living in energy poverty — reliant on kerosene lamps, petrol generators, or pure darkness.
The “100-percent electrification” claim thus collapses under the weight of its own numbers.
Where the Wires End
Field data from the World Bank’s Nigeria Electrification Project (NEP) identify only three officially commissioned renewable-energy mini-grids in Imo:
- Egbema Solar Microgrid (Ohaji-Egbema LGA)– 50 kW capacity, commissioned in 2023.
- Amumara Solar Farm (Ezinihitte Mbaise)– 100 kW capacity, completed in early 2024.
- Orodo Solar Hub (Mbaitoli LGA)– 30 kW pilot project under private concession.
Each project serves fewer than 500 households — impressive pilots, but hardly the foundation for a universal-access narrative.
The Anatomy of a Policy Mirage
A deep dive into government procurement records reveals a familiar pattern:
- Contracts awarded without proper needs assessment.
- Transformers purchased without feeder lines or substations.
- Projects inaugurated but left unconnected to the grid.
The REA project-tracking map lists over 21 stalled projects in Imo as of 2025 — many tagged “awaiting completion certificate.”
Yet state media platforms already list them as “commissioned.”
Communities Still in the Dark
In Umuguma, residents report that the transformer installed in 2022 blew up after three weeks.
In Oguta, the solar streetlights celebrated by the government during the 2023 “Rural Light Project” have not functioned since early 2024.
In Amakohia, youths rely on petrol-powered generators to charge phones and run small barbershops.
For rural artisans, cold-chain businesses, and welders, erratic power means lost income and wasted inventory.
Electrification is not a technical term — it is the difference between subsistence and survival.
The Fiscal Trail of “Light”
An analysis of the Imo State budget performance report (2020–2024) reveals inflated line items such as “Rural Transformer Rehabilitation – ₦1.8 billion” and “Solar Light Expansion – ₦2.2 billion,” with scant evidence of delivery on ground.
Independent verification by Tracka Nigeria (BudgIT) confirms that less than one-third of rural power projects listed in the 2023 budget were traceable to physical sites.
The pattern suggests an administration more invested in announcements than in amperes.
The Broader Context: Nigeria’s Energy Paradox
Across Nigeria, subnational governments routinely conflate “connection” with “access.”
But true energy access demands affordability, reliability, and sustainability.
According to the World Bank NEP Report (2023), over 85 million Nigerians remain unconnected, and millions more are “technically electrified” but functionally powerless.
Imo’s performance mirrors that paradox — political light, economic darkness.
The Human Story
At dusk in Ngor-Okpala, a young seamstress named Chika lights a kerosene lamp over her sewing machine.
Her shop’s solar panel stopped working six months ago.
The state government’s “100 percent electrified” slogan glows on a nearby billboard — powered, ironically, by a private generator.
The gap between slogan and streetlight is the measure of failed governance.
The Verdict
The claim that “all rural communities in Imo State are now electrified” is false.
Verified data from the REA, NBS, and World Bank show that less than half of Imo’s rural population enjoys functional electricity access.
The remainder depend on fuelwood, candles, and private generators.
At best, the state has achieved partial connectivity; at worst, it has achieved optical development — light that exists only on camera.
Until electrification moves from headlines to households, rural Imo will continue to dwell in the shadow of political wattage.
Bibliographies
BudgIT Foundation. (2025). State of States 2025: Sub-National Infrastructure and Energy Access Index. Lagos: BudgIT Publications.
International Renewable Energy Agency. (2024). Renewable Energy Statistics 2024 – Africa Regional Data. Abu Dhabi: IRENA.
National Bureau of Statistics. (2024). Nigeria Living Standards Survey 2024 – Energy Access Module. Abuja: NBS.
Rural Electrification Agency. (2024). Nigeria Off-Grid Energy Access Report 2024: Subnational Dashboard (Imo State Extract). Abuja: Federal Ministry of Power.
World Bank Group. (2023). Nigeria Electrification Project (NEP) – Implementation Status and Results Report. Washington, DC: The World Bank.