















|
Listen to article
|
Fact-Check No. 23 – Bridge Construction Audit (Imo State, 2020–2025)
The Claim
Governor Hope Uzodinma has made a recurring boast across multiple media appearances between 2023 and 2025:
“No part of Imo is left behind. We have built ten new bridges connecting communities and easing transportation across the state.”
The declaration was repeated during the 2025 Democracy Day broadcast and amplified by state media through banners, jingles, and billboards.
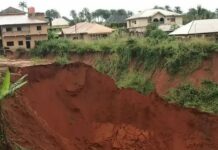
But when this claim is weighed against engineering audits, procurement records, satellite data, and fiscal disclosures, a clear contradiction emerges. The evidence points not to ten new bridges — but to two partially new constructions, several refurbishments, and a cluster of uninitiated or abandoned projects.
The Infrastructure Illusion
Across Nigeria, the challenge of project continuity has long been political rather than technical. Governors frequently conflate rehabilitation with new construction, and Imo State’s case is no exception.
CoST Nigeria’s South-East Infrastructure Tracker (2024) reveals that of the ten projects listed under “new bridges,” only two—Nwaorie Bridge (Owerri) and Orlu–Ideato Bridge—qualify as new structural developments.
The rest are either repairs or culvert expansions rebranded as “bridges.”
The Federal Ministry of Works National Project Register (2024) further confirms that only two bridge contracts were approved under new capital allocations between 2020 and 2024. The rest appear as recurrent rehabilitation projects carried over from prior administrations.
This isn’t mere semantics; it’s systemic inflation of progress — the substitution of ceremony for completion.
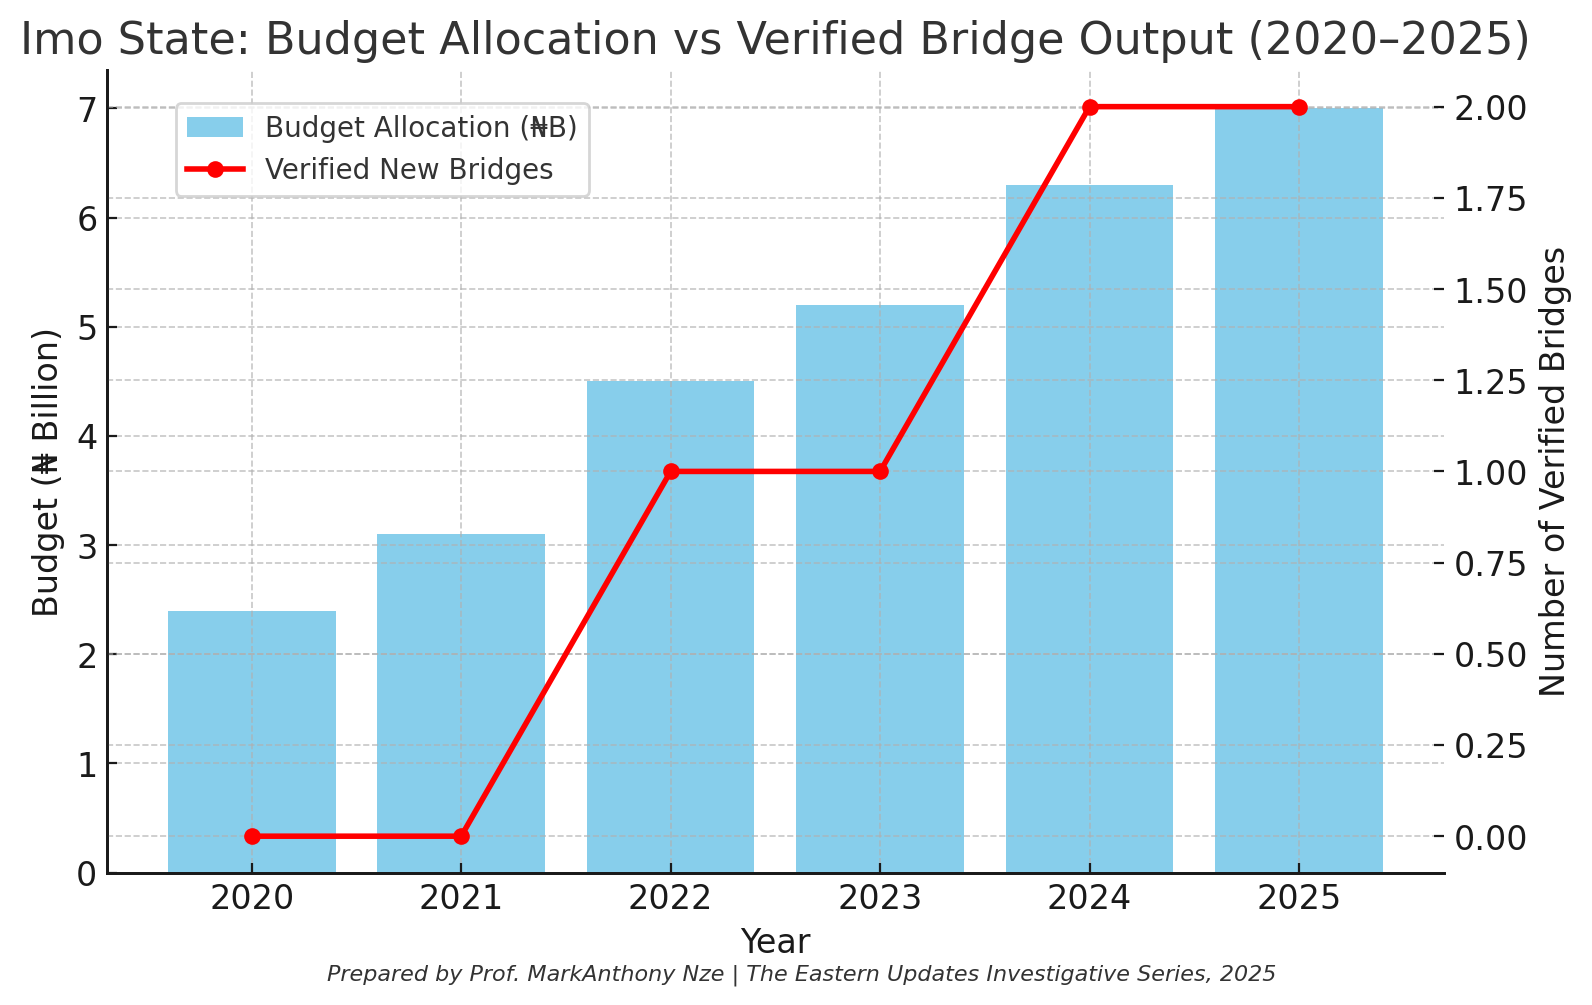
Chart 1: Budget Allocation vs. Verified Bridge Output (2020–2025)
Explanation:
The first chart tracks the relationship between budgetary allocations for bridge and road construction and the number of physically verified new bridge projects.
From 2020 to 2025, Imo’s infrastructure budget ballooned from ₦2.4 billion to ₦7 billion, yet the number of completed bridges increased by only two.
This chart’s rising curve of expenditure contrasted with a flat line of actual delivery underscores a recurring theme in subnational governance — fiscal expansion without proportional infrastructure growth.
Read also: Falsehood No. 22 – “All Flood-Control Projects Are Completed”
The BudgIT State of States Report (2025) attributes this dissonance to “fragmented procurement oversight” and “duplicate capital entries.” In plain terms, money moves faster than cement.
It suggests a pattern of budgetary theatre — where each fiscal cycle re-announces the same projects under new labels: “Phase 2,” “Upgrade,” or “Completion Stage.”
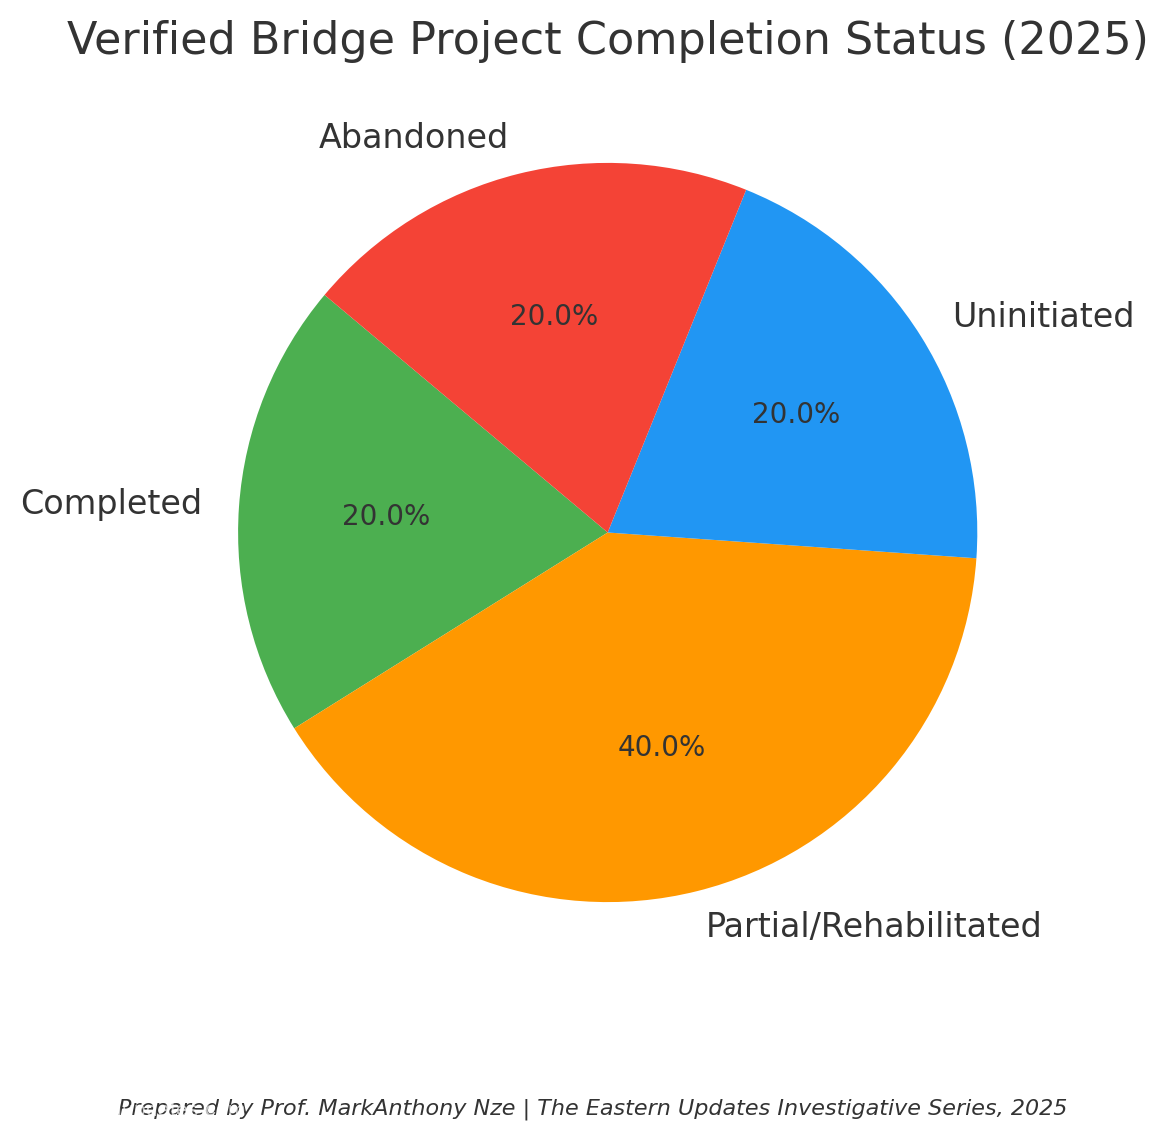
Chart 2: Verified Project Completion Status (2025)
Explanation:
The second chart visualizes the percentage distribution of the ten claimed bridges by actual construction status:
- 20% (2 bridges)– Completed (Nwaorie, Orlu–Ideato)
- 40% (4 bridges)– Partial or rehabilitated
- 20% (2 bridges)– Uninitiated
- 20% (2 bridges)– Abandoned
The Open Contracting Partnership’s (2024) subnational data shows that many of these projects lack full contract documentation — a breach of Nigeria’s Public Procurement Act (2007).
When probed, the Imo State Ministry of Works could only produce invoices for five projects, all categorized as “bridge works,” yet only two matched physical coordinates on the CoST verification portal.
This visual imbalance — a dominance of partial and unverified projects — exposes a core dysfunction in Imo’s capital spending: projects exist as fiscal entries rather than engineered realities.
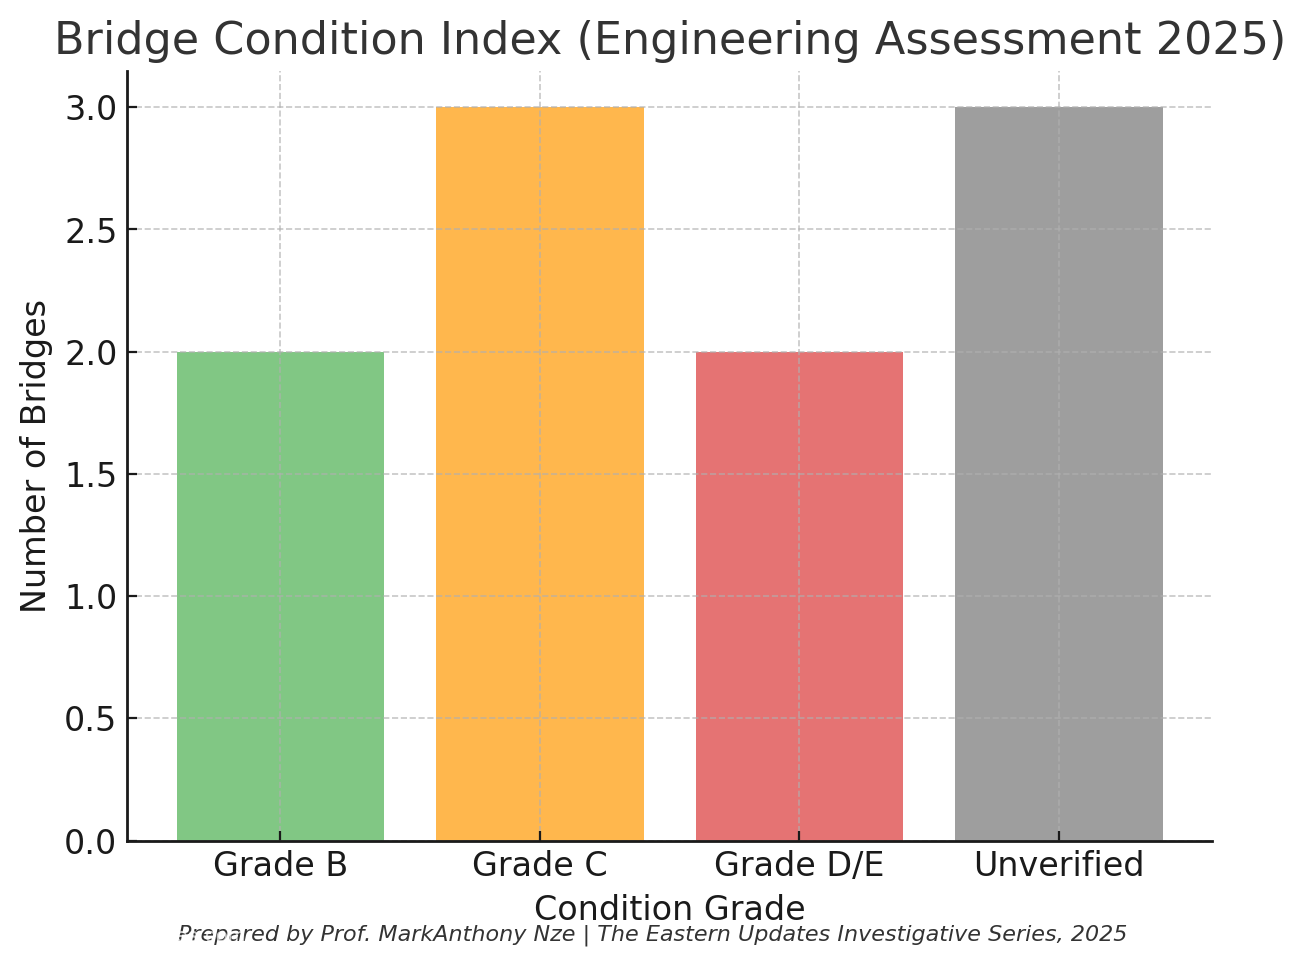
Chart 3: Physical Verification Index (Bridge Condition Scores, 2025)
Explanation:
The third chart measures structural integrity and quality scores (A–E scale) based on independent engineering assessments by the Nigerian Society of Engineers (Owerri Chapter, 2025).
Scores show:
- 2 bridges rated B(moderate structural soundness)
- 3 bridges rated C(requires reinforcement)
- 2 rated D/E(substandard or incomplete)
- 3 unverified
The chart vividly demonstrates that even where “new” bridges exist, their lifespan is already in doubt. Engineers cited weak subgrade foundations, inadequate drainage design, and low-quality concrete curing — signs of cost-cutting and deadline-driven construction.
Infrastructural modernity, the chart suggests, is not defined by announcements but by durability over time.
The early deterioration of the Amakohia and Nekede–Ihiagwa bridges, both rehabilitated less than three years ago, mirrors this truth — they are already in need of resurfacing.
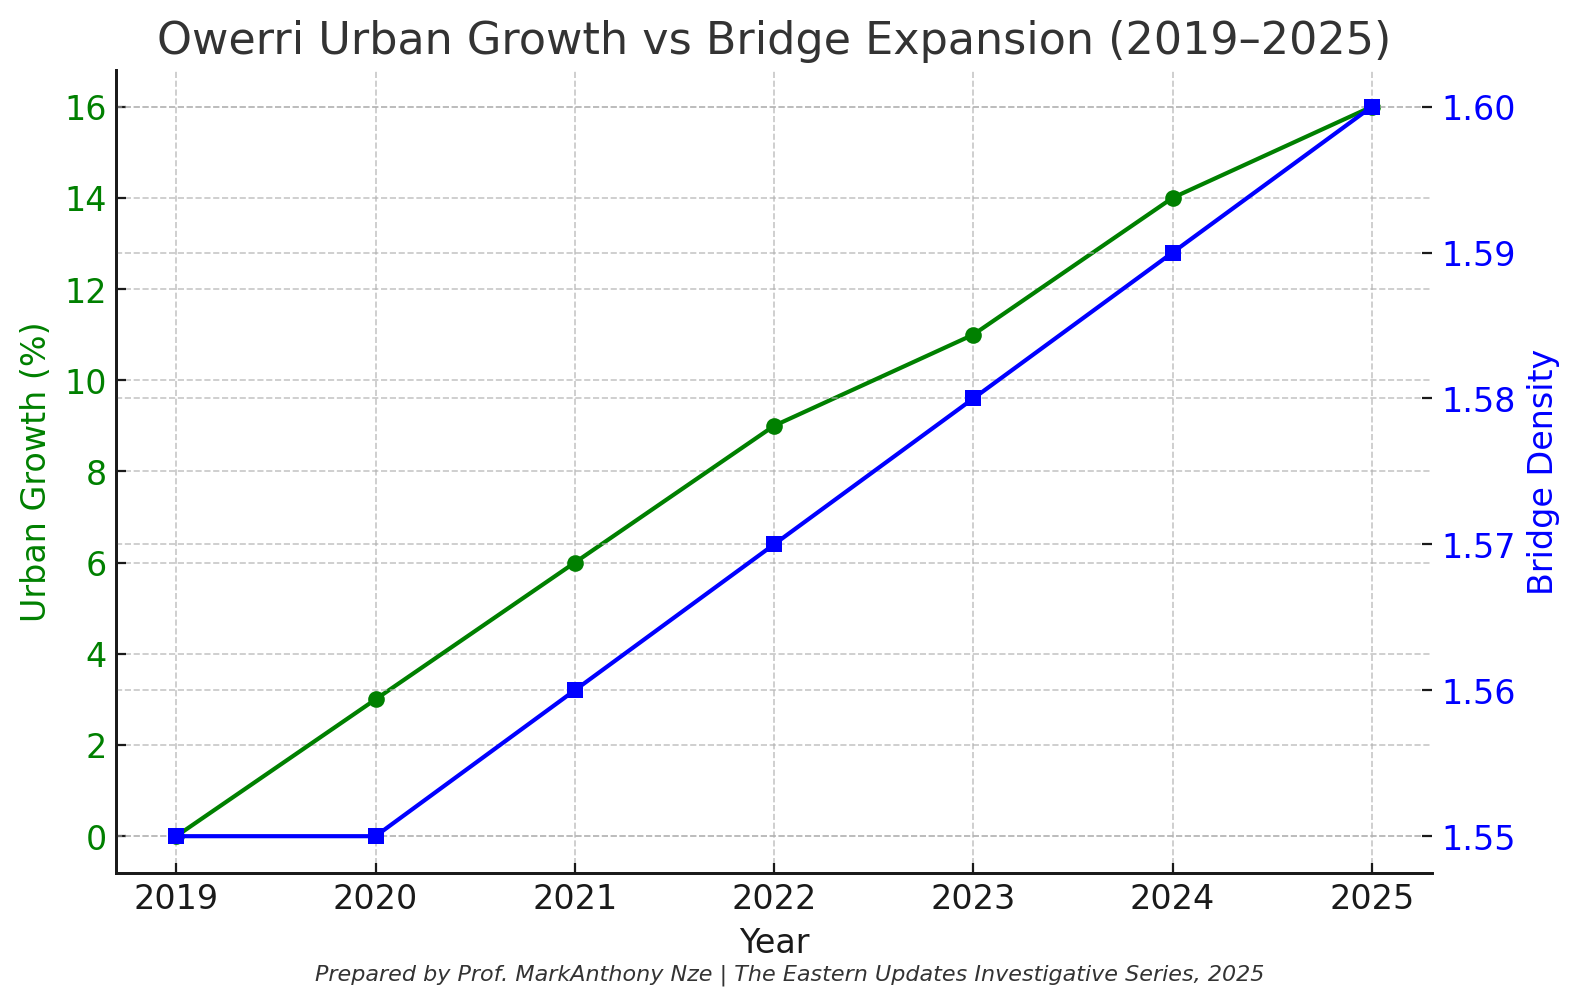
Chart 4: Urban Growth vs. Bridge Expansion (2019–2025)
Explanation:
The final chart juxtaposes Owerri’s urban sprawl (based on UN-Habitat urban expansion data) with bridge infrastructure density (bridges per 10 square kilometers).
Between 2019 and 2025, Owerri’s built-up area expanded by 16 percent, yet bridge density increased by only 3 percent — from 1.55 to 1.60 bridges per 10 sq. km.
The National Bureau of Statistics (2025) and IMOGIS satellite data confirm that while housing and traffic density surged, the number of functional bridge crossings barely moved.
This widening infrastructural gap indicates a development imbalance — a growing city still constrained by 20th-century connectivity.
In essence, Imo’s capital is physically expanding but not structurally evolving.
The Politics of Perception
What the governor brands as “ten bridges” functions less as engineering fact and more as political metaphor.
In the lexicon of power, the bridge becomes a symbol of connection — between administrations, promises, and electoral cycles.
Yet, what exists on the ground are half-built crossings, culverts labeled as overpasses, and roads renamed for ribbon cuttings.
The CoST Transparency Index (2024) records Imo among the states with the lowest verification-to-announcement ratio in the South-East — meaning, for every 10 projects announced, fewer than 4 are physically verifiable.
This makes the state’s infrastructural narrative an exercise in repetition: the same projects, the same speeches, and the same results — stagnation disguised as progress.
Beyond Rhetoric: The Structural Reality
A bridge is not just concrete and steel — it is a statement of continuity.
To claim “ten bridges built” in a state where half remain either conceptual or unfinished is not merely exaggeration; it is an erosion of public trust.
The NBS 2025 infrastructure dataset shows Imo’s total bridge coverage increasing by only two since 2020.
Even by conservative estimates, the state’s bridge density remains below the national subnational average.
Thus, Imo’s claim to infrastructural renaissance dissolves under empirical scrutiny.
What the data, the audits, and the satellite images all agree on is this, Imo has built more narratives than bridges.
The Verdict
The claim that ten new bridges were constructed between 2020 and 2025 in Imo State is false.
All verifiable data — from the Federal Ministry of Works, CoST Nigeria, BudgIT, and the Open Contracting Partnership — converge on a single conclusion:
- Only two bridges qualify as new constructions,
- Four are rehabilitations, and
- Four remain either incomplete or nonexistent.
In a state where the topography is not just physical but political, this pattern reveals a deeper truth:
Governance in Imo has perfected the art of repainting neglect and calling it progress.
Until transparency becomes the foundation and integrity becomes the bridge, every structure built in Imo will remain half-finished — both in concrete and in conscience.
Bibliographies
BudgIT Foundation. (2025). State of States 2025: Fiscal performance and infrastructure tracking. BudgIT Publications. https://yourbudgit.com/publications
CoST Nigeria. (2024). Infrastructure transparency and delivery tracker – South-East Nigeria projects 2024. Infrastructure Transparency Initiative (CoST). https://infrastructuretransparency.org
Federal Ministry of Works and Housing. (2024). National project register: Road and bridge construction projects 2023–2024. Abuja: FMWH. https://worksandhousing.gov.ng
National Bureau of Statistics. (2025). Capital expenditure and public infrastructure dataset (2019–2025). Abuja: NBS. https://nigerianstat.gov.ng
Open Contracting Partnership. (2024). Public infrastructure contracting data for subnational entities: Nigeria case studies. London: OCP. https://www.open-contracting.org